
OptiPilot Companion: the Chrome extension for debugging Optimizely
OptiPilot Companion is a developer tool that inspects and debugs an Optimizely Web Experimentation or Optimizely Feature Experimentation implementation on the page you are viewing, from inside a panel it adds to Chrome DevTools.
No OptiPilot account, no sign-in, and no charge — it is a debugging tool, not a service.
The questions Optimizely itself will not answer
Optimizely tells you which variation a visitor got. It does not tell you why. The panel is built around the four questions that cost experimentation teams the most time.
- Why was this visitor bucketed into that variation — or into none at all?
- Why did this audience match, or fail, or stay undecidable?
- Why did this tracking event not fire, or fire without the tags it needed?
- How exactly did Optimizely reach this Feature Experimentation flag decision?
Inside the panel
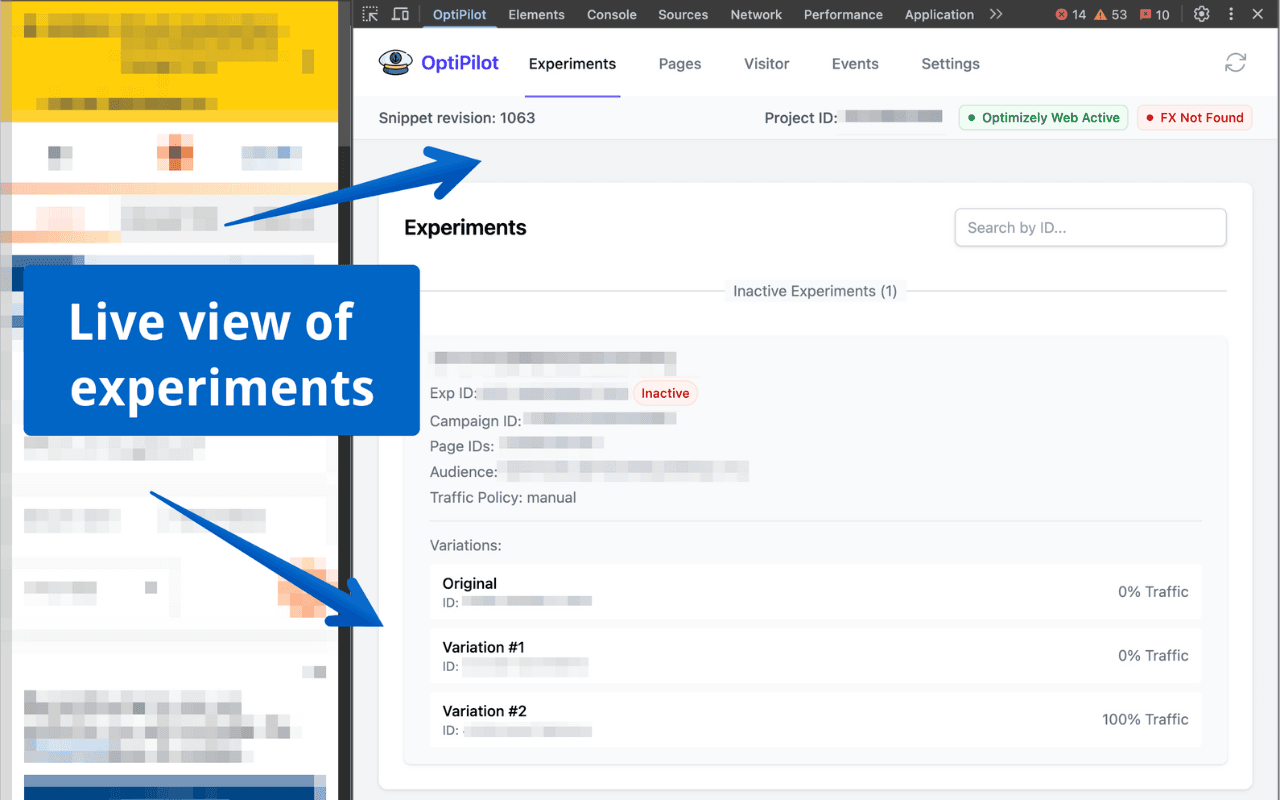
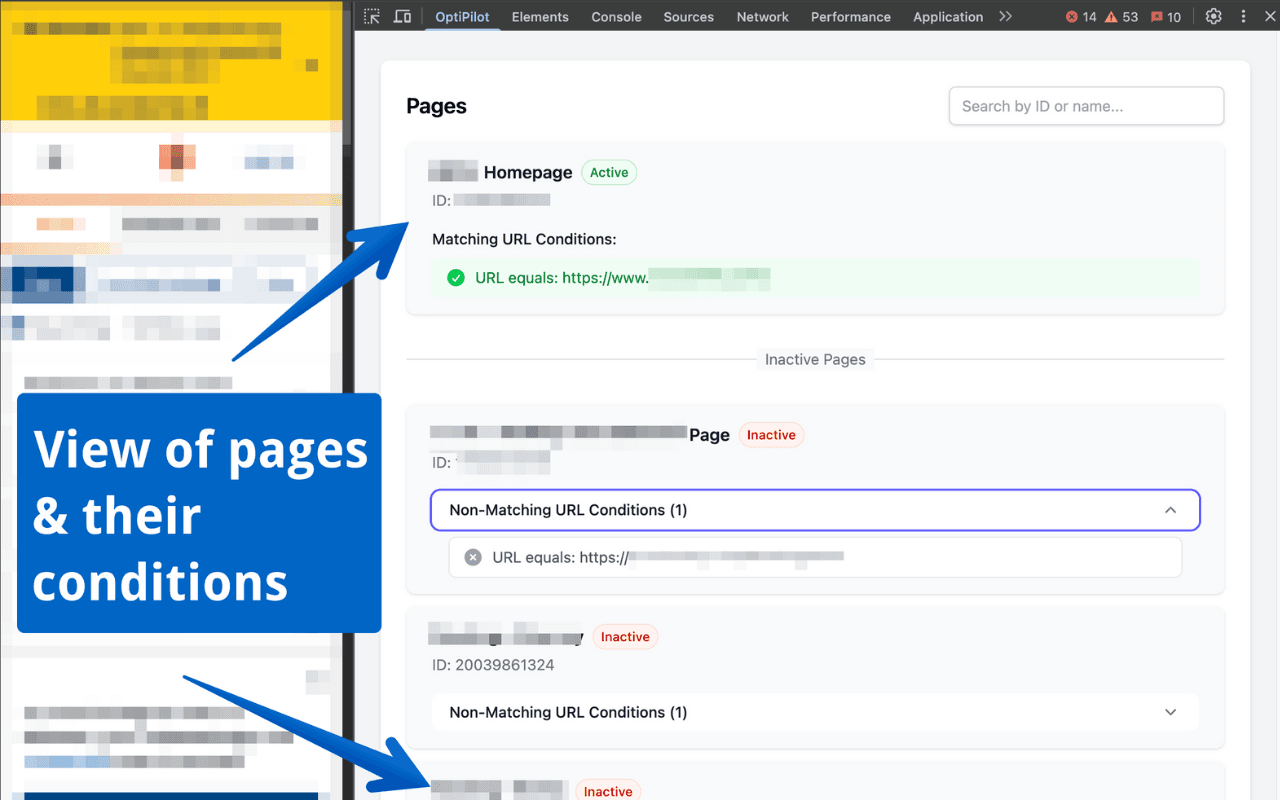
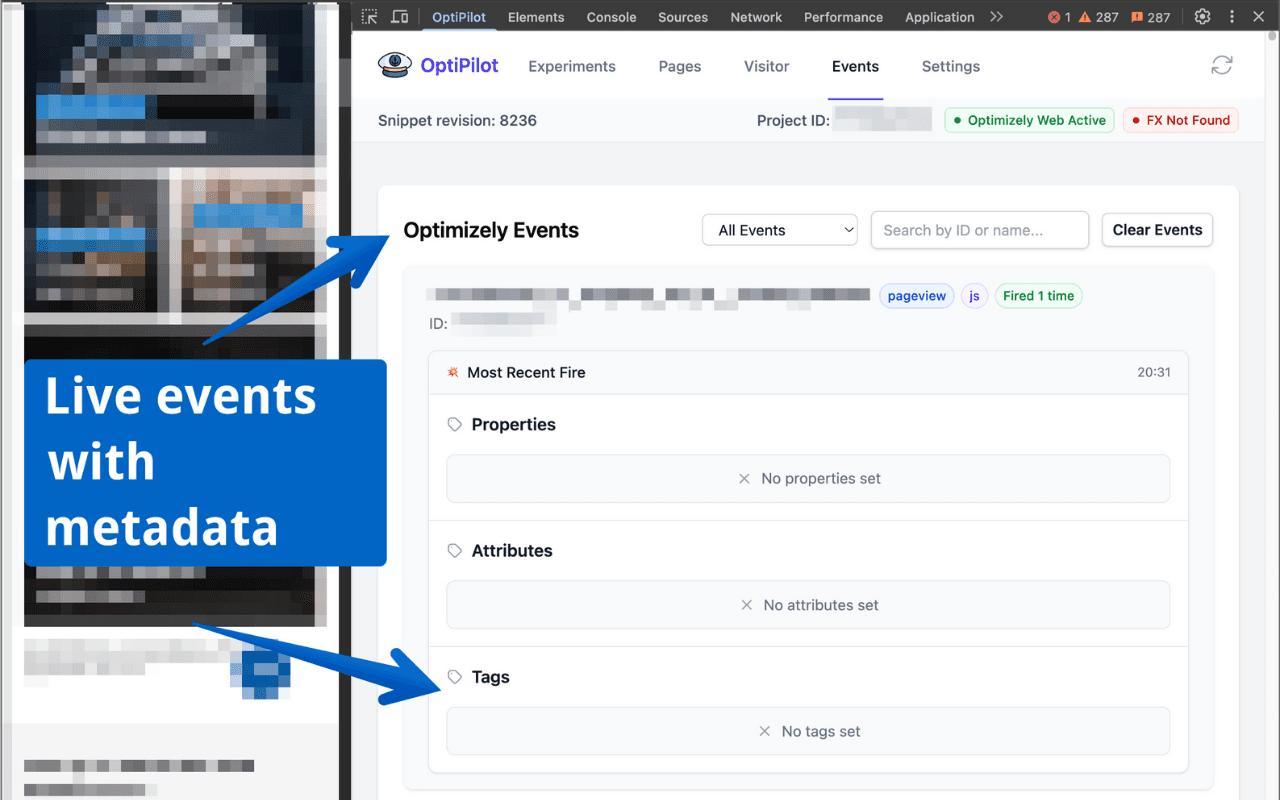
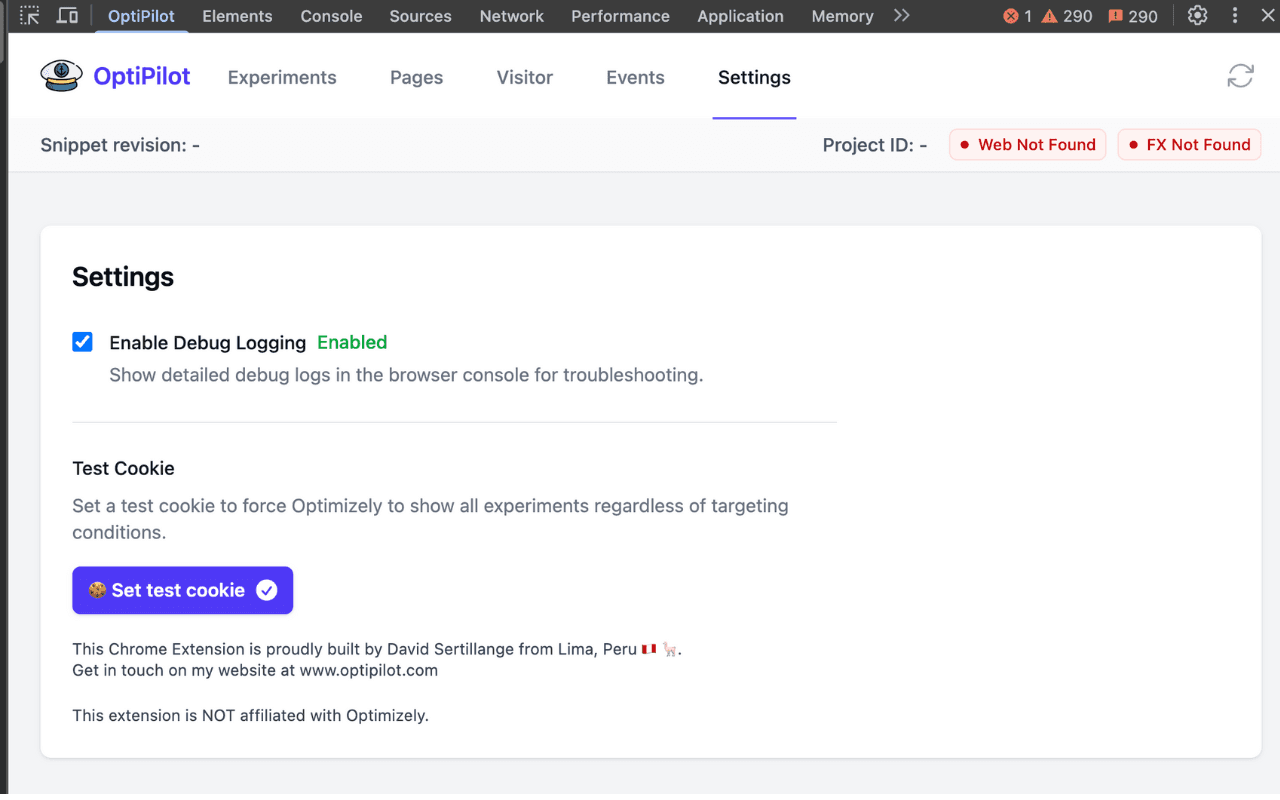
What it does
Thirteen shipped capabilities, grouped in the panel by the question they answer. Each one is a tool that already exists in the current release, not a plan.
Bucketing Trace Viewer
Follow the whole decision chain for a visitor: bucketing key, hash, the point it lands on in the 0–9999 space, the allocation range that contains it, and the variation that results. Group and holdback draws are shown as their own hashes, and you can type any visitor ID to see where they would land.
Event Firing Validator
Check outgoing events against their Optimizely definitions: events fired with no matching definition, missing or mistyped tags, events fired before the decision that should attribute them, and duplicates — each flagged inline with a copyable diagnosis.
Session Timeline
One chronological view of the pageview: snippet load, page activation, audience evaluation, decision, DOM application and events, with timings — instead of reconstructing the order from several separate tabs.
Pre-flight QA checklist
Run every check the panel knows how to make against an experiment before you launch it: targeting resolves, audiences are evaluable, variations are reachable, events are defined and firing, and variation code throws no console errors. The result is a shareable pass/fail report.
Variation Preview and DOM diff
Force any variation and see a diff of exactly what its code changed in the DOM, with a copyable snippet — so a QA reviewer can confirm the change is the one that was specified without reading the variation code.
Cookie and storage manager
Inspect and edit the Optimizely cookies and localStorage keys that drive bucketing and stickiness, with a pre-change snapshot, undo, backup, and a one-click reset visitor — instead of hand-editing them in Application → Storage.
Mutual exclusion group visualizer
See group allocation as a distinct hash draw from the variation draw, and get a plain explanation of why a campaign in an exclusion group was skipped for this visitor rather than a silent absence.
Feature Experimentation flag decisions
A datafile-driven decision trace for Feature Experimentation flags in Optimizely’s own order — forced, holdout, feature experiments, rollout — with separate group and variation hashes, presented as both a technical trace and a plain-English verdict.
Audience Unknown-State Debugger
Audience trees keep Optimizely’s three-valued logic end to end: true, false and unknown. An input the browser cannot see — DCP or behavioural data, list attributes, IP, location — is reported as unknown with the exact dependency needed to resolve it, never as failed targeting.
Redirect Experiment Trace
Decode Optimizely’s enhanced redirect relay payload so the destination page can show the complete pre-redirect campaign, experiment, variation, audience, visitor and activation provenance alongside the source-to-destination path, with confidence and loop-risk reporting.
Environment and datafile diff
Compare staging and production configurations for Web and Feature Experimentation, and compare a single flag across any number of environments — enabled state, rule status and priority, audience targeting, percentage ramp, variation weights and metrics, side by side.
Deep Trace
Turn Optimizely Web’s opt-in DEBUG log into one correlated timeline, combining filtered console output with lifecycle and action listeners, observed Optimizely network events, and Feature Experimentation notification listeners. It never calls decide() or changes a decision.
Redacted diagnostic export
Assemble a shareable diagnostic bundle — detected products, page host, the current decision traces, a recent-event and timeline summary, extension version — with a panel showing what is included and what was redacted before you download or copy it.
Both Optimizely experimentation products
Optimizely Web Experimentation
The panel reads the Optimizely state present on the page: experiments and campaigns, audience evaluation, the variation draw, exclusion groups, redirect provenance, and the events that fired. The bucketing key composition it traces was confirmed against a live Optimizely account rather than inferred.
Optimizely Feature Experimentation
Flag decisions are reproduced from the datafile in Optimizely’s own decision order. The engine is pinned by golden vectors generated with the real Optimizely SDK — 1,303 of 1,303 SDK-captured decisions reproduced exactly — so the trace matches what your application will do.
What it does with your data
You are installing a debugging tool that reads production pages, sometimes a client’s. These are the specific commitments the Chrome Web Store listing makes, not a summary of them.
- No analytics and no telemetry
- The extension sends no analytics and no telemetry anywhere, and there is no OptiPilot server behind it. Nothing about the sites you inspect is reported back to us, because there is nothing to report it to.
- Flag decisions are computed locally
- Feature Experimentation decisions are computed entirely locally from the datafile, in the page context. The decision engine is pinned against the real Optimizely SDK by golden vectors, so a local answer is the SDK’s answer rather than an approximation of it.
- Read locally, kept locally
- On-page Optimizely state, cookie and storage keys, request timings and any datafile you load stay in the browser’s local extension storage, scoped to the tab you are inspecting.
- The diagnostic export is redacted before it leaves
- The one bundle you can share is redacted first: full URLs and query strings are dropped and only the host is kept, cookie and storage values are removed, email addresses are masked, and visitor IDs are truncated. A panel shows exactly what is included before you download or copy anything.
- Deep Trace is opt-in and temporary
- Debug capture happens only after you start it explicitly. Records live in session storage for one five-minute window per tab, are capped at 500, and are removed when the tab closes — normal browsing collects nothing.
Install it and open DevTools
Install from the Chrome Web Store, open DevTools on any page running Optimizely, and pick the OptiPilot panel. There is nothing to configure and no OptiPilot account to create.