
Sequential Testing in A/B Tests: When Peeking Is Safe
 David SertillangeIndependent experimentation specialist
TL;DR
You launch a test, and by mid-afternoon the variation is up 8% with a green "statistically significant" badge. The obvious question is also the dangerous one: can you call it now, or do you have to wait? On most classical A/B testing setups the honest answer is that you were never supposed to be looking yet, and acting on that early peek quietly wrecks your error rate. Optimizely's Stats Engine is built specifically so that the answer flips to "yes, you can trust this look" — and the reason why is worth understanding before you ship a decision.
Why peeking breaks a fixed-horizon test
A classical, fixed-horizon A/B test (the kind powered by a t-test or z-test) makes one promise: if you fix the sample size in advance, collect exactly that many visitors, and test once at the end, then your false-positive rate is capped at your significance level — typically 5%. Every part of that promise depends on testing a single time at a pre-committed sample size. Which of the two tests a given metric calls for is covered in t-test vs z-test.
Peeking violates the promise. Each time you evaluate significance on accumulating data, you give random noise another independent chance to cross the threshold. The p-value of an A/A test (two identical variations) wanders up and down as visitors trickle in; over a long enough experiment it will dip below 0.05 purely by chance, even though there is nothing to find. Stop the moment it does, and you have "found" a winner that does not exist. This is the optional stopping problem, and it is a specific instance of the multiple-comparisons problem: more looks means more opportunities to be fooled.
The inflation is not subtle. Optimizely ran the experiment on itself — simulating A/A tests (no real difference) at 5,000 visitors and letting an observer peek. More than 57% of those A/A tests falsely declared a winner or loser at least once. Checking every 500 visitors produced a false-declaration rate around 26%; checking every 1,000 visitors, around 20%. Even applying a naive post-hoc correction still left error rates hovering near 25%. A test you believed was operating at 5% risk was actually running at four to eleven times that, entirely because someone looked early and acted.
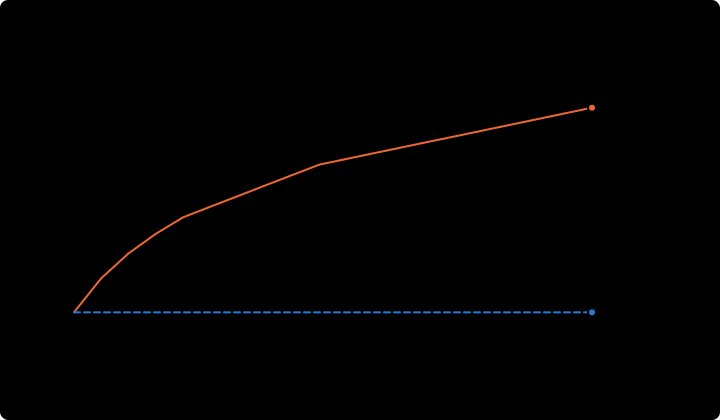
This is why a fixed-horizon test needs a pre-computed sample size, and why our sample size calculator exists: under fixed-horizon rules, the sample size is a contract you sign before the experiment starts and are not allowed to renegotiate by watching the results.
See the peeking problem in a short simulation
If the effect feels abstract, simulate it. The script below runs many A/A experiments — control and treatment drawn from the same 10% conversion rate — and checks a standard two-proportion z-test at 20 interim looks, declaring a "winner" the first time p < 0.05.
import numpy as np
from scipy import stats

def peeked_aa_test(n_max=10000, looks=20, alpha=0.05, rng=None):
    """One A/A experiment. Returns True if it EVER crosses significance."""
    rng = rng or np.random.default_rng()
    p = 0.10  # identical conversion rate for both arms — there is no real effect
    control = rng.random(n_max) < p
    treatment = rng.random(n_max) < p
    for n in np.linspace(n_max // looks, n_max, looks).astype(int):
        c_sum, t_sum = control[:n].sum(), treatment[:n].sum()
        pooled = (c_sum + t_sum) / (2 * n)
        se = np.sqrt(pooled * (1 - pooled) * (2 / n))
        if se == 0:
            continue
        z = (t_sum / n - c_sum / n) / se
        p_value = 2 * (1 - stats.norm.cdf(abs(z)))
        if p_value < alpha:      # stop the first time it "looks significant"
            return True
    return False

rng = np.random.default_rng(42)
trials = 5000
false_positives = sum(peeked_aa_test(rng=rng) for _ in range(trials))
print(f"20 peeks: false-positive rate = {false_positives / trials:.1%}")
# A single look at the final sample would sit near 5%.
# Peeking 20 times typically pushes this into the ~20–30% range.
The single-look version of this test behaves: evaluate only at n_max and the false-positive rate sits near 5%, exactly as advertised. Add the interim looks and it climbs into the 20–30% range — the same phenomenon Optimizely measured on real traffic. Nothing about the data changed; only the number of looks did.
Fixed-horizon, Bayesian, and sequential testing
There are three broad ways to analyze an experiment, and Optimizely supports all three. A baking analogy (Optimizely's own) makes the trade-off concrete before the mechanics do:
Frequentist (fixed-horizon) — You must decide the bake time before the cake goes in. You wait for the timer; opening the oven early and pulling the cake out ruins it, even if it looks done, because it may be raw inside.
Bayesian — You can open the oven whenever you like. Each look updates your belief about whether the cake is done, and you act on the probability accumulated so far. You are never told the cake is definitively "finished" — only how likely it is.
Sequential — You can open the oven whenever you like and get a trustworthy verdict each time. If it looks done, it is done.
The distinction that matters for peeking:
Property | Frequentist (fixed-horizon) | Bayesian | Sequential |
|---|---|---|---|
Sample size calculation | Required before starting | Not required | Not required |
Peeking mid-test | Not allowed | Allowed | Allowed |
Early stopping | Not allowed | Allowed | Allowed |
Result style | Significance / confidence intervals | Probability statements | Frequentist-style significance and confidence intervals |
Optimizely's Stats Engine is the sequential option. It gives you the continuous-monitoring freedom of a Bayesian approach while still reporting the frequentist-style significance and confidence intervals most experimentation teams already reason about. For a fuller treatment of the engine itself, see How the Optimizely Stats Engine works.
flowchart TD
  A[Starting an experiment] --> B{Can you fix a sample size in advance and not look until it is reached?}
  B -->|Yes, and you have strong stats expertise| C[Frequentist fixed-horizon]
  B -->|No, you want to monitor continuously| D{Which result style do you prefer?}
  D -->|Direct probability statements| E[Bayesian]
  D -->|Significance and confidence intervals| F[Sequential - Optimizely Stats Engine]
If you are weighing fixed-horizon, Bayesian, and sequential analysis for a specific test, the stats method picker walks you through the trade-offs.
What always-valid inference actually means
The property that makes peeking safe has a precise name: always-valid inference. A p-value (or confidence interval) is "always valid" if it holds its guarantee no matter when you choose to look and stop. With an always-valid p-value, you can check the test after every visitor, stop the first time it drops below your threshold, and your Type I (false-positive) error is still bounded by that threshold. The decision rule is safe under optional stopping by construction.
The mechanism, drawn from the academic work behind Stats Engine (Johari, Pekelis, and Walsh's Always Valid Inference, and the KDD paper Peeking at A/B Tests), is a mixture Sequential Probability Ratio Test (mSPRT), an idea tracing back to Robbins in 1970. Rather than computing a fresh single-shot p-value at each look, the engine maintains a running likelihood ratio that accumulates evidence across the whole stream of visitors. The always-valid p-value is essentially the reciprocal of that accumulated evidence, and the test is what Optimizely calls a "test of power one": the p-value now represents the chance the experiment will ever cross the significance threshold under the null. Because that quantity already accounts for every possible future look, looking early costs you nothing.
Note the attribution: mSPRT is the term used in the underlying literature. Optimizely's product documentation describes the same mechanism in plainer language ("an average likelihood ratio calculated every time a new visitor triggers an event") without naming it.
How sequential testing preserves the error rate
The fixed-horizon test fails under peeking because its 5% guarantee was only ever a promise about a single look. The sequential test makes a stronger promise from the start: the error bound holds across the entire sequence of looks, treated as one continuous procedure. Instead of spending your whole 5% error budget at one pre-chosen moment, the engine spreads and controls it across all looks simultaneously.
The visible consequence, documented by Optimizely, is that statistical significance in a stable experiment should generally increase over time as evidence accumulates, rather than fluctuate. Early on — when the sample is small — large observed gaps are treated conservatively, because a big early swing is exactly what noise produces. As the same-direction difference persists over more visitors, the engine becomes willing to call it. Two forms of evidence drive significance up: larger conversion-rate differences, and differences that persist across more visitors.
Real traffic is not a clean simulation, so significance can occasionally fall. Optimizely reports this happens in roughly 4% of experiments, from two causes: an early run of data that later looks like noise, or a genuine mid-experiment change in conditions. For the latter, Stats Engine has a protective stats reset that can drop significance sharply (potentially to 0%) when it detects that the underlying data-generating process has shifted. That is the safety mechanism doing its job, not a bug. Reducing metric variance up front — for example with CUPED variance reduction — is the cleaner way to reach a confident verdict sooner, rather than hoping an early peek holds.
False discovery rate control across metrics and variations
Peeking over time is one multiplicity problem. Testing many metrics and variations at once is another, and Optimizely handles it with a second layer: false discovery rate (FDR) control.
Classical significance controls the false-positive rate across all goals and variations. But you do not implement all of them — you implement the ones that won. Optimizely's documentation gives the sharp example: nine inconclusive results and one false winner is a 10% false-positive rate across everything, but if you only ship winners and one of two winners is false, your rate of shipping a false result is 50%. That "share of your declared winners that are actually null" is the false discovery rate, and it is the number that maps to a real business mistake.
Stats Engine controls FDR using a tiered Benjamini-Hochberg procedure:
Your primary metric is evaluated independently of the others, so it retains full statistical power and reaches significance as fast as possible.
Secondary metrics (ranked 2–5) have their thresholds adjusted for the number of metrics and variations; adding more of them slows each one down but never slows the primary.
Monitoring metrics (ranked beyond 5) each get a fractional weight of 1/n, so they contribute diagnostic signal without dragging on the metrics you actually decide on.
The practical takeaway: rank your metrics deliberately. The metric your decision hinges on belongs in the primary slot. One important caveat from the docs — FDR control is not maintained when you segment results. The deeper you slice, the more the false-positive risk climbs, so treat segments as exploration, not as a basis for decisions.
flowchart LR
  A[New visitor event] --> B[Update running likelihood ratio]
  B --> C[Recompute always-valid p-value and FDR-adjusted significance]
  C --> D{Threshold crossed?}
  D -->|No| E[Keep running - the current read is still valid]
  E --> A
  D -->|Yes| F[Declare winner or loser - safe to stop and act]
When you can stop the test
Here is the direct answer to "am I allowed to stop when it looks significant?" With Optimizely's Stats Engine, yes — a variation that has crossed your significance threshold on the primary metric is a valid result you can act on, with a few practitioner caveats:
Do a launch sanity check first. Statistical validity does not catch a broken implementation. Early in the test, confirm the variation renders correctly, events fire, and traffic split roughly matches your allocation (a sample ratio mismatch usually signals a setup bug, and no statistical engine repairs biased data).
Decide on the metric you ranked primary. Secondary and monitoring metrics are context, not the verdict. See reading the Optimizely results page for how each is displayed.
Weigh practical significance, not just statistical significance. A result can be real and still too small to justify the engineering cost of shipping. Check that the confidence (improvement) interval clears the effect size you actually care about.
Let it run a full business cycle when you can. Statistical validity at any look is not the same as representativeness. If your traffic behaves differently on weekends or across a purchase cycle, a Tuesday-only sample may be valid but unrepresentative. Covering at least one full weekly cycle guards against novelty and day-of-week effects. (This is practitioner best practice, not a statistical requirement of the engine.)
Within those guardrails, you do not owe the test a pre-computed sample size, and you are not penalized for looking. That is the entire point of sequential inference.
Common misconceptions
"Peeking is always cheating." Peeking breaks fixed-horizon tests. Under an always-valid method it is a designed-in feature. The sin is peeking with the wrong statistical engine, not peeking itself.
"Sequential testing is just Bayesian testing." Both allow continuous monitoring, but they answer different questions. Bayesian testing reports the probability a variation is better given a prior; sequential testing reports frequentist significance and confidence intervals that stay valid under optional stopping. Optimizely's Stats Engine is sequential, not Bayesian.
"Significance dropping means the tool is broken." In a stable experiment, significance generally climbs. A drop usually reflects a real change in conditions or an early false signal correcting itself — and a stats reset is the safeguard, not a defect.
"Always-valid means I can ignore sample size entirely." You can skip the pre-commitment to a sample size, but low-traffic tests still take real time to accumulate evidence, and tiny true effects still need many visitors. Always-valid inference removes the peeking penalty; it does not remove the need for data.
"I can slice the winning segment and trust it the same way." FDR control is not maintained across segments. A segment that looks like a standout is a hypothesis for a future test, not a result to ship.
The short version: with a fixed-horizon test you must set the timer before you bake and never open the oven. With Optimizely's sequential Stats Engine you can open the oven whenever you like — and when the result looks done, it genuinely is.
Independent experimentation specialist
David Sertillange is an independent experimentation specialist with 10 years implementing Optimizely across enterprise programs. He specializes in Feature Experimentation, analytics integrations, and helping teams build a culture of data-driven decision making.
Related articles
Subscribe
Practical Optimizely tips, monthly. No fluff.